Below are links to my final project presentation and write-up regarding the Bobwhite-Manatee Transmission Line Project. I really liked this final as it helped tie together many of the things we learned over the semester. I have a much better understanding of GIS and its application after this semester.
http://students.uwf.edu/ojy1/Bobwhite-Manatee_Project_Report.pdf
http://students.uwf.edu/ojy1/Bobwhite-Manatee_Project_Presentation.pptx
Monday, April 26, 2010
Tuesday, April 6, 2010
Week 11 Lab - Module 1 3D Analyst
Tin Map

The 3D capabilitites of ArcGIS amaze me. This was a simple map to make but the extensions from this base map through the vitural course was very informative.

Week 11 Lab - Module 1 Spatial Analyst
Image 3. Model Builder
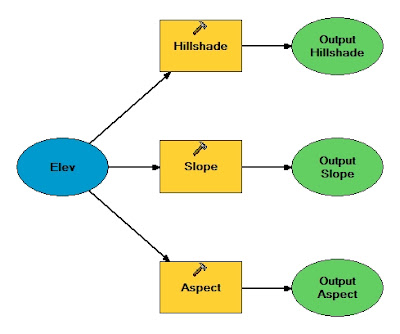
The model builder is a neat tool, it is awesome that you can build a model with graphics and then run the model from that graphic interpretation.

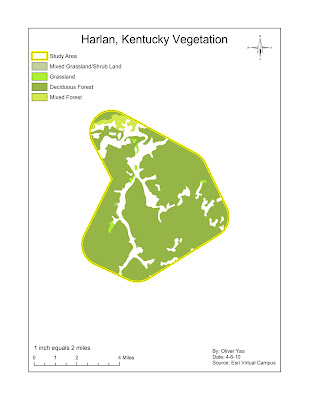
Map 4. Vegetation Reclassification
Again, this was an educational exercise that showed how powerful some of the arc toolbox items can be in making work easier.

Week 11 Lab - Module 1 Labels and Annotations
Map 1. Final Cities and Roads Map of Greater Tampa Area


This map was fun to do, I learned a lot about labeling with weights, scaling, label manager etc.

Map 2. Recreation Map of Greater Tampa Area
This lab I liked learning how to apply custom labels and use the callout options.

Monday, March 29, 2010
GUlf County Top Landowners
Here is my map of the top four largest landowners in Gulf County. This lab was fun to do. I had a hard time finding the County outline, roads, and hydrology.

Saturday, March 20, 2010
Vector Analysis II Lab
1. Which tool did you use? Intersect
Was there any noticeable difference between its results and the results from the instruction? No, in both cases I had 4 matches. However, the resulting maps were different. The intersect only displayed areas water and road buffer overlapped.
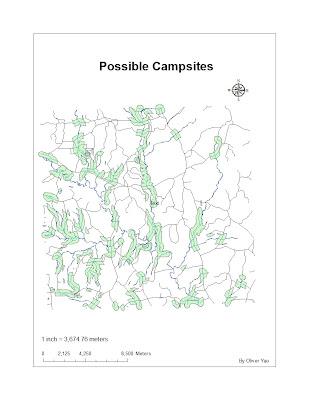
2. Which tool did you use here and why? Erase overlay since I wanted to exclude the conservation areas from my search
3. How many features are in this layer? 79 features
What is the area of the largest feature? 7,765,034 sq meters
What is the area of the smallest feature? 748 sq meters
Was there any noticeable difference between its results and the results from the instruction? No, in both cases I had 4 matches. However, the resulting maps were different. The intersect only displayed areas water and road buffer overlapped.
2. Which tool did you use here and why? Erase overlay since I wanted to exclude the conservation areas from my search
3. How many features are in this layer? 79 features
What is the area of the largest feature? 7,765,034 sq meters
What is the area of the smallest feature? 748 sq meters

Monday, March 1, 2010
Lab 6 UWF Campus Edited
Here is my Lab 6. This lab was a great exercise in editing layers. I need to practice more but I can see how editing can be a powerful tool in keeping maps and layers up to date.

Friday, February 26, 2010
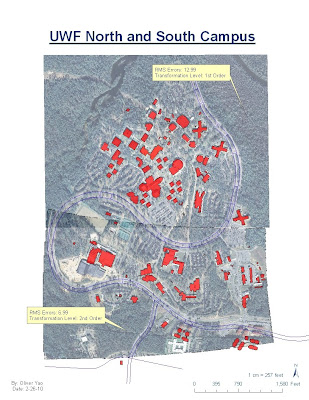
Lab Module 5 - Georeferencing
Here is my Lab 5 - Georeferencing map of UWF. This lab was a lot of fun. I had issues at first with the RMS errors being really high. Once I started zooming in and adding points my RMS values dropped significantly. I also would delete any high values and use new points to being the RMS down. I am suprised that my RMS was so low for south campus. I also only had to use 10 points.

Sunday, February 21, 2010
Lab Module 5 - St. Lucie County
Here is my map for St. Lucie County, Florida. This was a fun lab trying to find all the data sources. I did have problems with the DRG, DEM, DOQQ at first but found some help from a classmate.

Wednesday, February 10, 2010
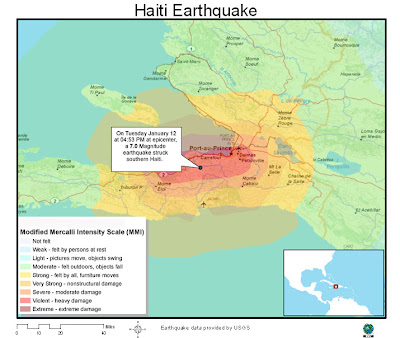
Haiti Earthquake Response Map
Below is a map I found while browsing the web for Haiti GIS maps. The map is from Esri and it displays the Modified Mercalli Intensity measurements for the areas surrounding the affected region. This map is helpful in showing where the most intesity was felt and the relation to major cities in Haiti.

Tuesday, February 9, 2010

Tuesday, February 2, 2010
Week 3 Lab
Map 1 - Mexico Populations

Map 2 - Mexico Rivers, Railroads, Federal Roads, and Urban Areas

Map 3 - Mexico Elevations

Sunday, January 24, 2010

Tuesday, January 19, 2010
+1-19-10.jpg)
Map 2, Potential Youth Center Locations.
The first pitfall I had was step 5 Select available buildings by location. I thought once the query was complete only my selections would show and the rest of the dots would disappear.
The second pitfall I had was at step 7 when I zoomed to select the text at beneath the North arrow. When I zoomed I lost my map and had to redo setting my reference scale to get the map back.
Thursday, January 14, 2010
.jpg)
Tuesday, January 5, 2010
Subscribe to:
Comments (Atom)